
GST Collection April 2024

 GST Collection April 2021 to April 2024


Analysis of GST Collection

Table of Content:

  1. GST Collections Tren
  2. Breakdown of April 2024 Collections
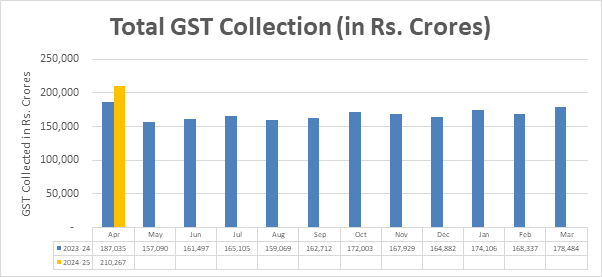
  3. Total GST Collections


GST Collection


GST has emerged as one of the important source of revenue for both state and central government in India. This notes aims to provide in depth information and analyze on GST collection on the bases of date received from the government report. The above presented chart offers a comprehensive view on the GST collection since April 2021. The GST  collection data shows a significant upward growth from April 2021 to 2024. GST collection reached to high if Rs. 2.1 lakh crore in April 2024. This increased was possible because of increase on domestic transaction and imports. 


Breakdown of April 2024 Collections:

  • Central Goods and Services Tax (CGST): Rs. 43,846 crore;
  • State Goods and Services Tax (SGST): Rs. 53,538 crore;
  • Integrated Goods and Services Tax (IGST): Rs. 99,623 crore, including Rs. 37,826 crore collected on imported goods;
  • Cess: Rs. 13,260 crore, including Rs. 1,008 crore collected on imported goods.


 State-wise growth of GST Revenues during April, 2024

State/UT

Apr-23

Apr-24

Growth (%)

Jammu and Kashmir

803

789

-2%

Himachal Pradesh

 957

      1,015

6%

Punjab

2,316

     2,796

21%

Chandigarh

 255

313

23%

Uttarakhand

2,148

    2,239

4%

Haryana

10,035

   12,168

21%

Delhi

6,320

     7,772

23%

Rajasthan

4,785

     5,558

16%

Uttar Pradesh

10,320

  12,290

19%

Bihar

1,625

     1,992

23%

Sikkim

426

 403

-5%

Arunachal Pradesh

238

 200

-16%

Nagaland

   88

 86

-3%

Manipur

    91

104

15%

Mizoram

    71

108

52%

Tripura

 133

161

20%

Meghalaya

239

 234

-2%

Assam

 1,513

     1,895

25%

West Bengal

6,447

     7,293

13%

Jharkhand

3,701

    3,829

3%

Odisha

5,036

    5,902

17%

Chhattisgarh

3,508

    4,001

14%

Madhya Pradesh

4,267

     4,728

11%

Gujarat

11,721

   13,301

13%

Dadra and Nagar Haveli and Daman & Diu

399

447

12%

Maharashtra

33,196

   37,671

13%

Karnataka

 14,593

   15,978

9%

Goa

620

765

23%

Lakshadweep

      3

 1

-57%

Kerala

3,010

     3,272

9%

Tamil Nadu

11,559

   12,210

6%

Puducherry

 218

247

13%

Andaman and Nicobar Islands

   92

 65

-30%

Telangana

5,622

    6,236

11%

Andhra Pradesh

4,329

    4,850

12%

Ladakh

   68

 70

3%

Other Territory

220

225

2%

Center Jurisdiction

 187

221

18%

Grand Total

     1,51,162

  1,71,433

13%


Analysis

  • High Performers: States like Punjab, Haryana, Delhi, Assam, and Bihar have recorded significant growth, reflecting strong economic activity.
  • Declining States: Jammu and Kashmir, Sikkim, Arunachal Pradesh, and a few others have shown a decline in GST collections, possibly due to local economic challenges or reduced trade activities.
Impact of GST Collection on Indian Economy


REVENUE COLLECTION IN THE LAST 5(FIVE) YEARS
(IN crores)

Year

GST

Non-GST

Total

Growth%

2017-18

500.00

785.46

1285.46

-

2018-19

878.96

645.20

1524.16

18.57

2019-20

1011.24

584.63

1595.87

4.70

2020-21

994.76

742.90

1737.66

8.88

2021-22

1280.87

738.13

2019.00

16.19


References
1)https://pib.gov.in/PressReleaseIframePage.aspx?PRID=2019262

2) https://dea.gov.in/monthly-economic-report-table

3) https://meggst.gov.in/RevenueCollection.pdf

GST#economics#2024#April#revenue#collection

<script async src="https://pagead2.googlesyndication.com/pagead/js/adsbygoogle.js?client=ca-pub-1532912266618611"
     crossorigin="anonymous"></script>

Comments

Popular posts from this blog

Global Inflation Rate

 Inflation Rate: A Global Comparison   Country 2020 2021 2022 2023 2024 Maximum Minimum Average Zimbabwe 557.21 98.546 193.399 667.361 560.981 667.361 98.546 415.4994 Argentina 42.015 48.409 72.431 133.489 249.793 249.793 42.015 109.2274 Sudan 163.258 359.092 138.808 171.471 145.535 359.092 138.808 195.6328 Venezuela 2355.15 1588.51 186.542 337.458 99.981 2355.15 99.981 913.53 Türkiye 12.279 19.596 72.309 53.859 59.52 72.309 12.279 43.5126 South Sudan 23...

Impact of Global Pandemic COVID-19 on Various Sectors of India

  Impact of Global Pandemic COVID-19 on Various Sectors of India As we know that COVID-19 has affected across the world. India is one of the worst affected country in the world of COVID-19. It has affected negatively on Indian economy and its various sectors. Generally, we believe like that COVID-19 has affected negatively to various sectors of Indian economy. What do you think?? what is the impact of COVID-19 on various sectors of India??? Your answer may be a negative impact of COVID-19 on various sectors of India. But this is not right answer of this question.  You are right one. Because of People around us always talk about negative impact of COVID-19 on Indian economy.  But this is not the real pictures of the impact of COVID-19 on various sectors of the economy. I want to take you to different picture of impact of COVID-19 on various sectors of Indian economy. There are two kinds of impact of COVID-19 on sectors of Indian economy: Positive and Negative. You might ha...